
“Are my PSEO pages different enough?” is the central quality question for programmatic content. Too similar and you're generating near-duplicates. Too rigid about uniqueness and you can't scale efficiently. You need a way to measure differentiation objectively.
Uniqueness scoring provides that measurement. Instead of subjective assessment (“these seem similar”), you get numbers: Page A is 73% similar to Page B. Your threshold is 70% maximum similarity. Page A either passes or fails.
This framework covers how to build a uniqueness scoring system for PSEO—the metrics to track, calculation methods, threshold setting, and integration with your content pipeline.
What to Measure
Uniqueness isn't a single dimension. Different aspects of your pages can be more or less unique, and the right mix depends on your content type.
Text Similarity
The most straightforward metric: how much of the actual text is shared between pages? This catches template text that appears identically across pages.
Calculation approaches:
- Character-level matching — What percentage of characters are identical?
- Sentence-level matching — What percentage of sentences appear in both pages?
- N-gram similarity — How many word sequences (typically 3-5 words) match?
For PSEO, sentence-level matching often provides the clearest signal. Character-level catches variable substitutions; n-gram catches semantic similarity.
Data Variation
Beyond text, measure how much the underlying data differs. Two pages with completely different product lists but identical template text are more unique than the similarity percentage suggests.
Data variation metrics:
- Product/entity overlap — What percentage of products appear on both pages?
- Data point uniqueness — Are the specifications, prices, ratings different?
- Category distance — How related are the segments these pages target?
Semantic Differentiation
Even with different words, pages can be semantically equivalent. “Best project management software for agencies” and “Top project management tools for agencies” are semantically near-identical despite different phrasing.
Semantic similarity uses embeddings or NLP models to assess meaning overlap rather than word overlap. This catches subtler duplication that text matching misses.
| Metric Type | What It Catches | Limitation |
|---|---|---|
| Text similarity | Identical template text | Misses paraphrased duplicates |
| Data variation | Same entities, different context | Doesn't assess text quality |
| Semantic similarity | Meaning overlap | Computationally expensive |
Calculating Scores
Once you've decided what to measure, you need a system to calculate and aggregate scores.
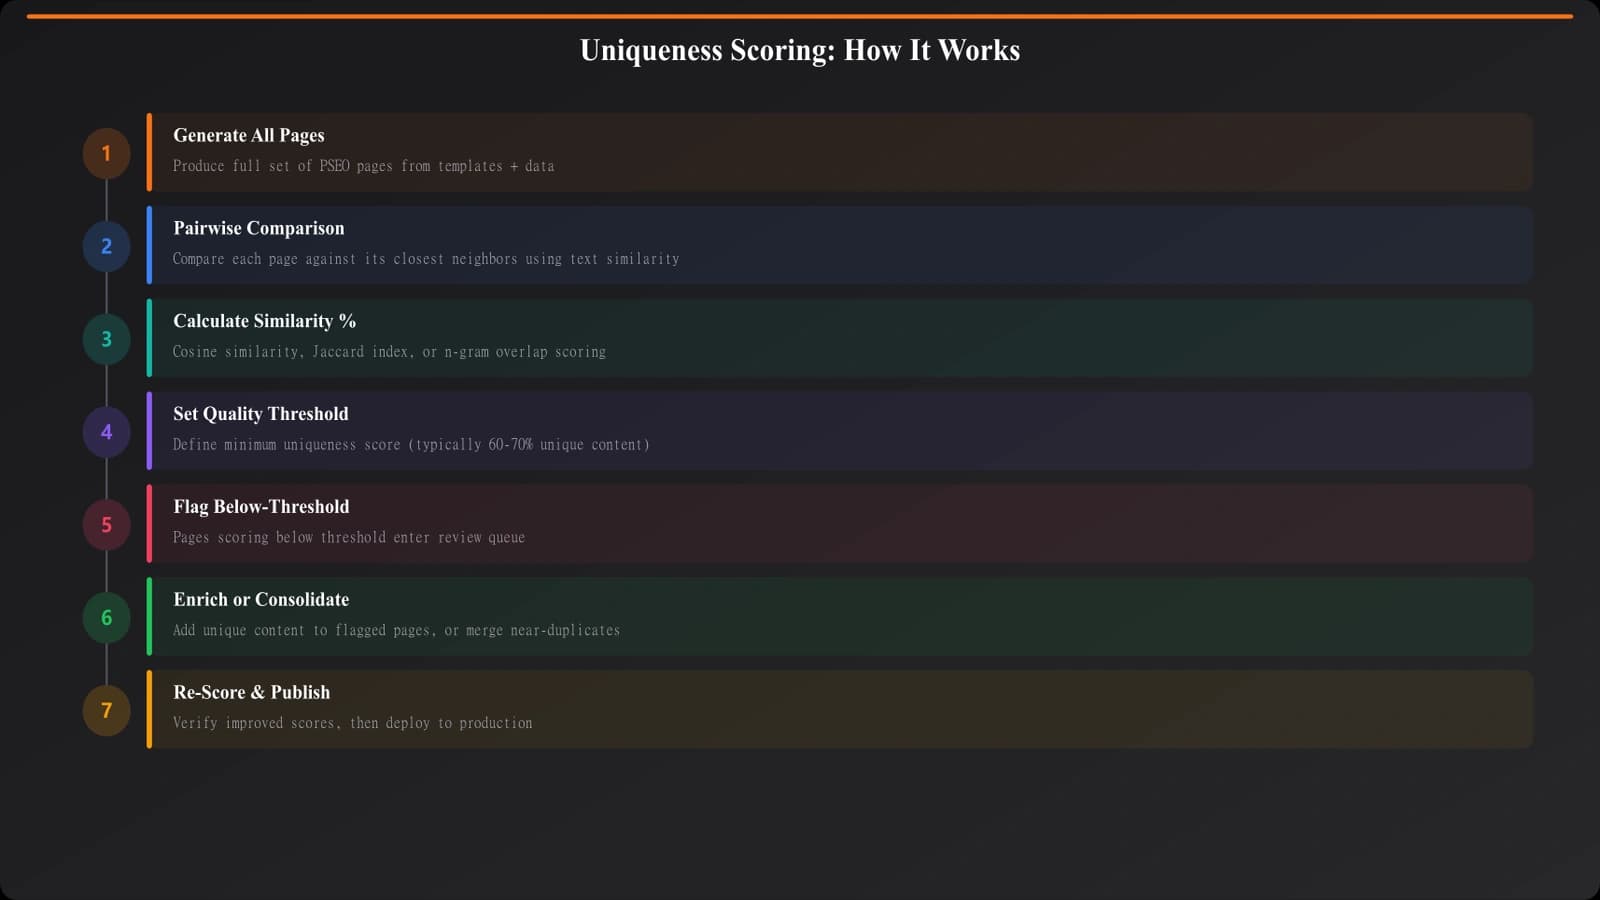
Pairwise Comparison
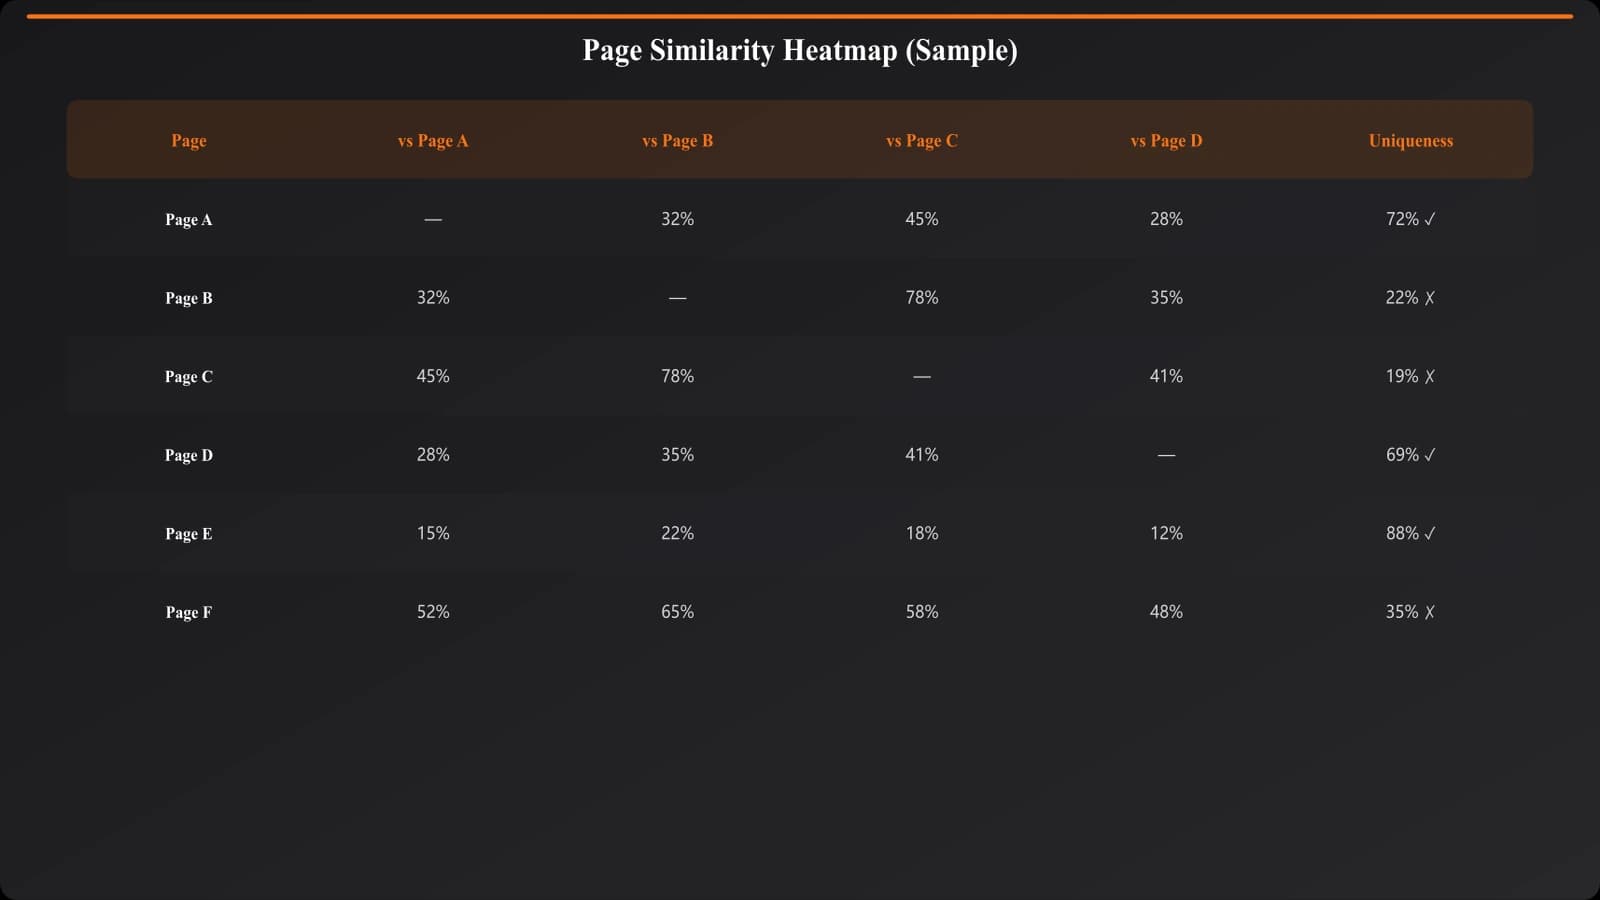
The foundational approach: compare each page to every other page in its category. This produces a similarity matrix showing how unique each page is relative to its siblings.
For large page sets, full pairwise comparison becomes computationally expensive. Sampling strategies help—compare each page to its 10 nearest neighbors rather than all 10,000 pages.
Building a Composite Score
Combine your metrics into a single uniqueness score. The formula depends on your priorities:
Uniqueness Score = (Text Uniqueness × 0.4) + (Data Variation × 0.4) + (Semantic Differentiation × 0.2)
Adjust weights based on what matters for your content. If your template is minimal and data is the differentiator, weight data variation higher. If you're adding significant editorial content, weight text uniqueness higher.
Setting Thresholds
Your uniqueness score means nothing without a threshold. What score is “good enough”?
Start with industry benchmarks, then calibrate:
- Below 50% unique: Almost certainly too similar. Flag for review or noindex.
- 50-70% unique: Borderline. May need enhancement depending on context.
- 70-85% unique: Generally acceptable for programmatic content.
- 85%+ unique: Strong differentiation. No concerns.
Calibrate by sampling pages at different score levels and manually assessing whether they feel legitimately different. Adjust thresholds based on findings.
Generate Unique Pages at Scale
Built-in uniqueness scoring ensures every page passes differentiation thresholds.
Try for FreePipeline Integration
Uniqueness scoring is most valuable as a pipeline gate, not a post-hoc audit.
Pre-Generation Check
Before generating a new page, check if it would be sufficiently unique from existing pages. If the predicted content is too similar to what already exists, skip generation or merge with the existing page.
This requires estimating uniqueness from the inputs (keywords, data) rather than the full generated content—faster and prevents wasted generation effort.
Post-Generation Validation
After generation but before publishing, calculate the actual uniqueness score. Pages below threshold go to a review queue:
- Calculate score for new page
- If score >= threshold → approve for publishing
- If score < threshold → flag for review
- Review determines: enhance, consolidate, or noindex
Ongoing Monitoring
As you add pages, overall uniqueness can drift. New pages might be fine individually but push aggregate similarity higher. Monitor average uniqueness across your PSEO page set over time.
Set alerts for when aggregate scores drop below acceptable levels—a sign that your templates or data sources need attention.
Building Your Scoring System
Uniqueness scoring transforms subjective quality judgment into measurable metrics. Instead of hoping your pages are different enough, you know.
Start simple: implement text similarity scoring with basic thresholds. As your pipeline matures, add data variation and semantic measures. Integrate scoring as a pipeline gate rather than optional audit.
The investment in scoring infrastructure pays off through consistent quality at scale—no more discovering thin content problems after thousands of pages are indexed.
For complementary quality measures, see Avoiding Thin Content in PSEO and Listicle Refresh System.
Product Manager at BestPage. Pioneer in AEO research since 2024, exploring the convergence of SEO and GEO (Generative Engine Optimization). Led multiple AI-powered content optimization projects that achieved 300%+ citation increases in ChatGPT and Perplexity.