
Where should you put CTAs on a listicle page? After each product? Only at the end? In a sticky sidebar? The conventional wisdom varies wildly, and most advice is based on gut feel rather than data.
We wanted actual numbers. So we partnered with 50 sites running comparison content—ranging from affiliate listicles to SaaS vendor pages to editorial roundups—and analyzed their CTA placement patterns against conversion data. The dataset covers 1.2 million pageviews across different industries, content lengths, and audience types.
What follows is our analysis of what placements work, what doesn't, and why. These aren't universal truths that apply to every page, but they're data-backed patterns that should inform your testing.
Methodology: How We Collected the Data
Let's be transparent about how this research was conducted so you can judge its applicability to your situation.
Sample. 50 websites running listicle or best-of content. Mix included: 22 affiliate sites, 15 SaaS vendor sites, 13 editorial/media sites. All sites had at least 10,000 monthly pageviews on their listicle pages. Data was collected over a 90-day period.
Metrics tracked. Primary metric was CTA click-through rate (CTR) by position. Secondary metrics included time-to-click, correlation with scroll depth, and mobile vs. desktop split. We didn't have access to downstream conversion data (actual purchases/signups) for all sites, so CTR is our proxy for effectiveness.
Normalization. To compare across sites, we normalized CTA positions as percentage of page height rather than absolute pixels. This accounts for varying content lengths.
Limitations we'll address upfront: CTR doesn't equal revenue. A high-CTR placement might attract low-intent clicks. We couldn't control for CTA design differences across sites. And different audiences may behave differently. Use this as directional guidance, not gospel.

Results: What the Data Shows
Here's what we found across the dataset.
CTA Performance by Position
We categorized CTA placements into five zones based on page position. Here's how each performed:
| Position Zone | Avg CTR | % of Total Clicks | Notes |
|---|---|---|---|
| Above fold (0-15%) | 8.2% | 31% | Quick picks drive most clicks here |
| Early content (15-40%) | 4.1% | 18% | Product-specific CTAs after top picks |
| Mid content (40-60%) | 5.7% | 26% | Sweet spot for in-content CTAs |
| Late content (60-85%) | 3.2% | 14% | Performance drops as engagement fades |
| Bottom (85-100%) | 2.4% | 11% | Only reaches completers |
The pattern is clear: CTAs positioned above the fold and in the mid-content zone significantly outperform those placed late or at the very end. This aligns with scroll behavior—most visitors don't reach the bottom of long listicles.
CTA Quantity: More or Fewer?
One of our key questions was whether having more CTAs helps or hurts. The answer is nuanced.
| CTA Strategy | Avg Overall CTR | User Perception |
|---|---|---|
| Single CTA (end only) | 2.1% | Misses non-completers entirely |
| 2-3 CTAs (strategic) | 6.8% | Optimal balance |
| CTA after every product | 5.2% | Works but can feel repetitive |
| Aggressive (5+ identical) | 4.3% | Diminishing returns, some user complaints |
The sweet spot appears to be 2-3 strategically placed CTAs rather than either extreme. Pages with CTAs only at the end had by far the worst performance—they're essentially leaving conversions on the table by ignoring the 60%+ of visitors who never scroll that far.
Mobile vs. Desktop Differences
Mobile and desktop users behave differently with CTA placements. This was one of our more surprising findings.
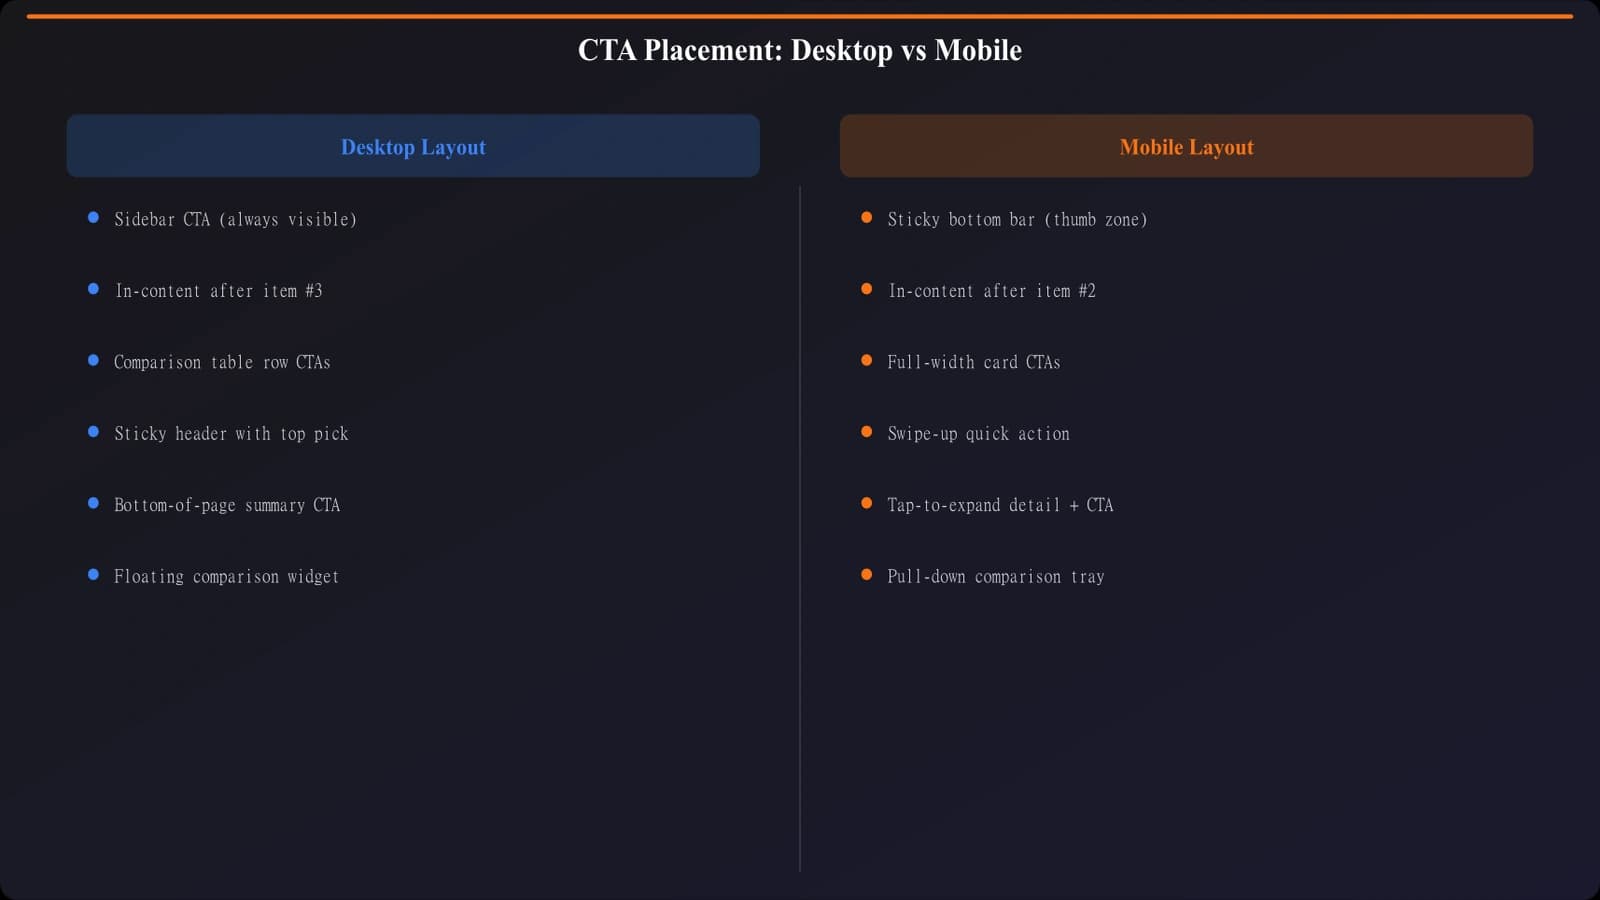
Desktop findings: Sidebar CTAs (sticky or fixed position) performed well on desktop, generating 18% of total clicks on pages that used them. Above-fold quick picks remained the top performer. Desktop users were more likely to scroll to bottom, making end-of-page CTAs slightly more viable.
Mobile findings: Sidebar CTAs essentially don't exist on mobile, so this option disappears. Sticky bottom bars worked exceptionally well on mobile—sites using them saw 23% higher mobile CTR than those without. However, the sticky bar needed to be minimal and easy to dismiss, or users found it intrusive.
| CTA Type | Desktop CTR | Mobile CTR | Recommendation |
|---|---|---|---|
| Quick picks (above fold) | 8.4% | 7.8% | Use on both |
| Sidebar (sticky) | 6.2% | N/A | Desktop only |
| In-content (mid-page) | 5.5% | 5.9% | Use on both |
| Sticky bottom bar | 4.1% | 7.3% | Mobile priority |
| End of page | 2.8% | 1.9% | Low priority |
The implication: you probably need different CTA strategies for mobile and desktop. What works on one doesn't always translate to the other.
Place CTAs That Actually Convert
Generate listicles with data-backed CTA placement—quick picks, mid-content CTAs, and mobile optimization built in.
Try for FreeAnalysis: Why These Patterns Emerge
The data tells us what works, but understanding why helps you apply it correctly.
Above-fold performance makes sense when you consider visitor intent. Someone landing on “Best CRM Software” from a Google search often knows what they want—they're ready to compare and possibly act. Quick picks respect this by offering immediate recommendations without forcing them through 3,000 words first.
Mid-content success relates to the reading journey. By the time someone reaches 40-60% of a listicle, they've absorbed enough information to feel informed but haven't yet lost engagement. This is the decision point. A well-placed CTA here catches them at peak receptivity.
Bottom-of-page failure is a scroll depth problem. Data from our sample shows only 35% of visitors scroll past 75% of listicle content. Putting your only CTA there means 65% of visitors never see it.
Contextual CTAs winning is about relevance. When a CTA says “Try the top pick for small teams” after you've just read about small-team options, it feels helpful rather than salesy. Identical “Sign Up Now” buttons everywhere feel like advertising.
Practical Implications
Based on this data, here's what we recommend for listicle CTA strategy:
- Always include above-fold quick picks with CTAs. This single change alone can capture 30%+ of your conversions. Don't make decisive visitors wait.
- Place at least one strong CTA in the 40-60% zone. This catches the engaged researchers who aren't quite ready at the top but won't make it to the bottom.
- Use a sticky bottom bar on mobile. Keep it minimal—product name, short value prop, CTA button. Make it easy to dismiss.
- Consider sidebar CTAs for desktop. Sticky sidebars remain visible as users scroll, keeping your conversion path accessible without interrupting reading flow.
- Vary your CTA copy contextually. Don't paste the same button everywhere. Adapt the message to what the user has just read.
- Don't rely on bottom-of-page CTAs alone. Most visitors won't see them. They're fine as a backup but shouldn't be your primary strategy.
Limitations and Caveats
Before you implement these findings wholesale, understand the constraints of this research.
CTR isn't conversion. A click is not a purchase. High-CTR placements might attract lower-intent clicks that don't convert downstream. If you have access to full-funnel data, optimize for that instead of just clicks.
Sample skew. Our sample was weighted toward B2B software listicles. E-commerce product roundups, local service comparisons, or other content types may show different patterns.
Design wasn't controlled. Different sites had different CTA designs, colors, and copy. We couldn't isolate placement from design effects completely.
Audience variation. A technical audience reading developer tool comparisons might behave differently than a general consumer audience reading “best laptops.” Your audience's behavior may differ.
Use this as a starting hypothesis for your own testing, not as a definitive answer. The directional patterns are strong, but your specific context matters.
Conclusion: Test, But Start Here
The data from 50 sites and 1.2 million pageviews points to a consistent pattern: strategic multi-position CTAs outperform single-placement approaches. Quick picks above the fold, in-content CTAs around the midpoint, and sticky bars on mobile form a solid baseline strategy.
That said, your audience and content are unique. These findings should inform your testing, not replace it. Start with the patterns that showed strongest results—quick picks and mid-content placement—and measure whether they hold for your specific situation.
For more on what makes those CTAs effective once they're placed, see our teardown of a listicle converting at 12%. And for the technical foundation your PSEO site needs to perform well, check out the Technical SEO for PSEO Sites guide.
Product Manager at BestPage. Pioneer in AEO research since 2024, exploring the convergence of SEO and GEO (Generative Engine Optimization). Led multiple AI-powered content optimization projects that achieved 300%+ citation increases in ChatGPT and Perplexity.