
Default analytics dashboards aren't designed for comparison content. They show generic metrics that don't answer the questions comparison site operators actually have: Which listicles are performing? Which products get the most clicks? Which pages are decaying and need updates?
This template solves that problem. It provides a purpose-built dashboard structure for comparison sites, organized around the metrics and views that matter for listicle and comparison content. The dashboard connects to Google Analytics 4 and Search Console—the two data sources most comparison sites already have.
Below, we'll walk through each section of the dashboard, explain what metrics to include, and provide the specifications you need to build it yourself in Looker Studio or adapt to other dashboarding tools.
Dashboard Structure
The dashboard is organized into four main sections, each answering different questions about your comparison content.
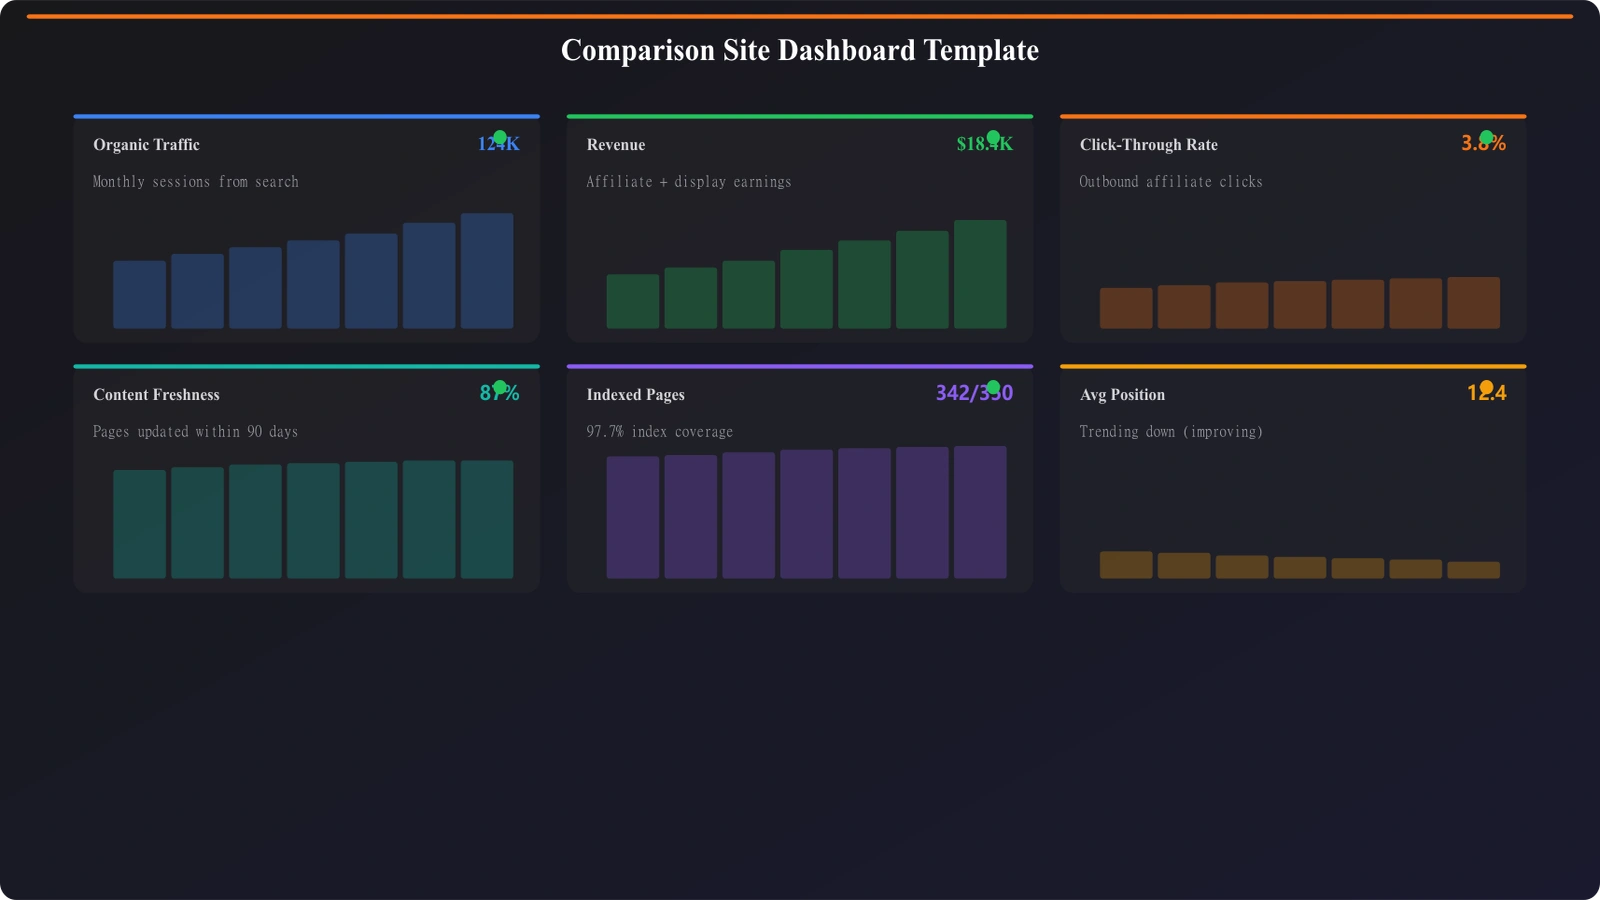
Section 1: Performance Overview
The overview section provides at-a-glance metrics for your entire comparison content library. This is what you check daily to understand overall performance.
Key metrics to include:
| Metric | Data Source | Display Type | Comparison |
|---|---|---|---|
| Total organic sessions | GA4 | Scorecard | vs previous period |
| Comparison page sessions | GA4 (filtered) | Scorecard | vs previous period |
| Total impressions | Search Console | Scorecard | vs previous period |
| Average position | Search Console | Scorecard | vs previous period |
| Outbound click rate | GA4 (custom event) | Scorecard | vs previous period |
Visualizations to include:
- Traffic trend: Time series chart of comparison page sessions over last 90 days
- Traffic by category: Breakdown of sessions by comparison category (CRM, PM tools, etc.)
- Top performing pages: Table of top 10 pages by sessions
- Organic vs other traffic: Pie chart showing traffic source breakdown
Section 2: Page-Level Performance
This section lets you drill into individual page performance. It's where you identify winners and underperformers.
Page performance table columns:
| Column | Data Source | Notes |
|---|---|---|
| Page title/URL | GA4 | Identifiable page name |
| Category | Custom dimension | For filtering/grouping |
| Sessions | GA4 | Total sessions this period |
| Sessions % change | GA4 calculated | vs previous period |
| Impressions | Search Console | SERP impressions |
| Average position | Search Console | Weighted average position |
| CTR | Search Console | Click-through rate from SERPs |
| Outbound clicks | GA4 event | Clicks to products |
| Click-through rate | Calculated | Outbound clicks / sessions |
Filters to include:
- Date range selector
- Category filter (dropdown)
- Content type filter (listicle, alternatives, vs comparison)
- Performance filter (growing, stable, declining)
Section 3: Content Decay Monitoring
This section surfaces content that needs attention before traffic crashes.
Decay indicators table:
| Column | Calculation | Alert Threshold |
|---|---|---|
| Page | Page identifier | - |
| Sessions (30d) | Last 30 days sessions | - |
| Sessions change | vs previous 30 days | Red if >20% decline |
| Position change | vs previous 30 days | Red if +2 or more |
| Days since update | Content modified date | Yellow if >90, red if >180 |
| Decay status | Composite score | Watch / Warning / Critical |
Visualizations:
- Decay status distribution: Pie/bar chart showing how many pages in each status
- Pages needing refresh: Filtered table of Warning + Critical pages
- Decay trend: How many pages entered decay status over time
Section 4: Revenue and Conversions
For monetized comparison sites, this section tracks the metrics that matter most: conversions and revenue.
Key metrics:
- Total outbound clicks: All clicks to products/services
- Outbound click rate: Clicks / sessions
- Revenue (if trackable): From affiliate platforms
- Estimated value: Clicks × average affiliate value
Revenue by page table:
| Column | Data Source |
|---|---|
| Page | GA4 |
| Sessions | GA4 |
| Outbound clicks | GA4 event |
| Click-through rate | Calculated |
| Top clicked products | GA4 event parameter |
| Revenue (if available) | Imported data |
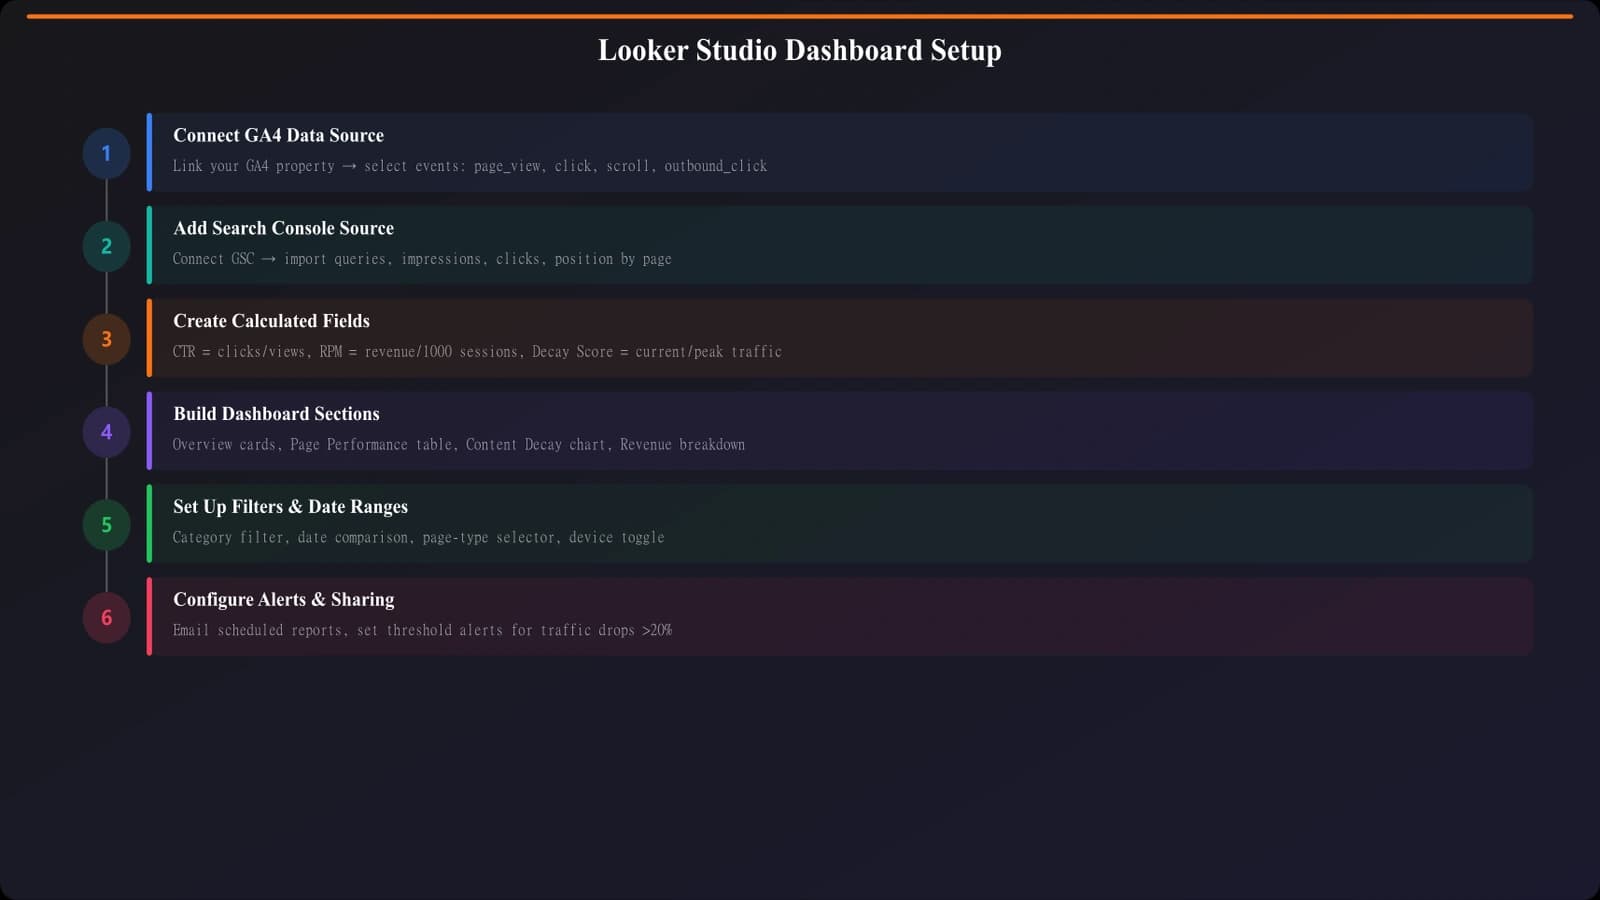
Setup Guide
Here's how to build this dashboard in Looker Studio.
Step 1: Connect Data Sources
You'll need to connect:
- Google Analytics 4: Use the native GA4 connector
- Search Console: Use the native Search Console connector (site impression type)
- Optional - Content metadata: Google Sheet with page metadata (category, last updated date, content type)
Step 2: Set Up Custom Events in GA4
Before the dashboard can show comparison-specific metrics, you need to track them in GA4:
- outbound_click: Event fired when user clicks to a product
- Parameters: product_name, product_position, click_location
- scroll_depth: Events at 25%, 50%, 75%, 100% scroll
- comparison_interaction: Filter usage, expand actions, etc.
Step 3: Create Calculated Fields
In Looker Studio, create calculated fields for:
- Click-through rate:
outbound_clicks / sessions - Session change %:
(sessions - sessions_prev) / sessions_prev - Days since update:
DATE_DIFF(TODAY(), last_updated_date) - Decay status: CASE statement based on session change and position change thresholds
Step 4: Build Dashboard Pages
- Create a new Looker Studio report
- Add your data sources
- Create four pages matching the sections above
- Add the specified metrics and visualizations to each page
- Apply consistent styling and date controls across pages
Build Analytics-Ready Comparison Pages
Create comparison content with built-in tracking for meaningful performance insights.
Try for FreeCustomization Options
Adapt this template to your specific needs.
Category Customization
Replace the generic category filters with your actual categories:
- Update the category dimension in your GA4 custom dimensions
- Modify the Google Sheet metadata source with your categories
- Update filter dropdowns in Looker Studio
Revenue Integration
If you have affiliate revenue data:
- Basic: Import monthly revenue by page from a Google Sheet
- Advanced: Use API to pull real-time affiliate data
- Estimated: Calculate estimated revenue using average click values
Additional Views
Consider adding pages for:
- Product performance: Which products get most clicks across all pages
- Query analysis: Which search queries drive traffic to comparison pages
- Competitive tracking: Position monitoring vs specific competitor domains
- Publication calendar: Content update schedule and compliance
Using the Dashboard
Once built, use the dashboard in your regular workflows:
| Frequency | Review Focus | Actions |
|---|---|---|
| Daily | Overview scorecards | Spot any major anomalies |
| Weekly | Content decay section | Add warning pages to refresh queue |
| Weekly | Top performers | Identify optimization opportunities |
| Monthly | Full dashboard review | Trend analysis, strategy adjustments |
| Monthly | Revenue section | Assess monetization health |
The dashboard is most valuable when it becomes part of a routine, not something you check only when problems occur. Regular review helps you catch issues early and capitalize on opportunities quickly.
For the metrics this dashboard tracks, see our guide on Engagement Metrics That Actually Matter. For content decay monitoring in detail, check out Content Decay: Catch Declining Listicles Early.
Product Manager at BestPage. Pioneer in AEO research since 2024, exploring the convergence of SEO and GEO (Generative Engine Optimization). Led multiple AI-powered content optimization projects that achieved 300%+ citation increases in ChatGPT and Perplexity.