
Search Console tells you what Google has indexed. Log files tell you what Googlebot actually does on your site. That distinction matters enormously for programmatic SEO, where you might have 10,000 pages but only 3,000 are being crawled regularly.
Server logs capture every request to your server, including crawler visits. By filtering for search engine bots and analyzing their behavior patterns, you discover which pages receive crawl attention, which are ignored, and how bots navigate your site structure. This information is unavailable anywhere else.
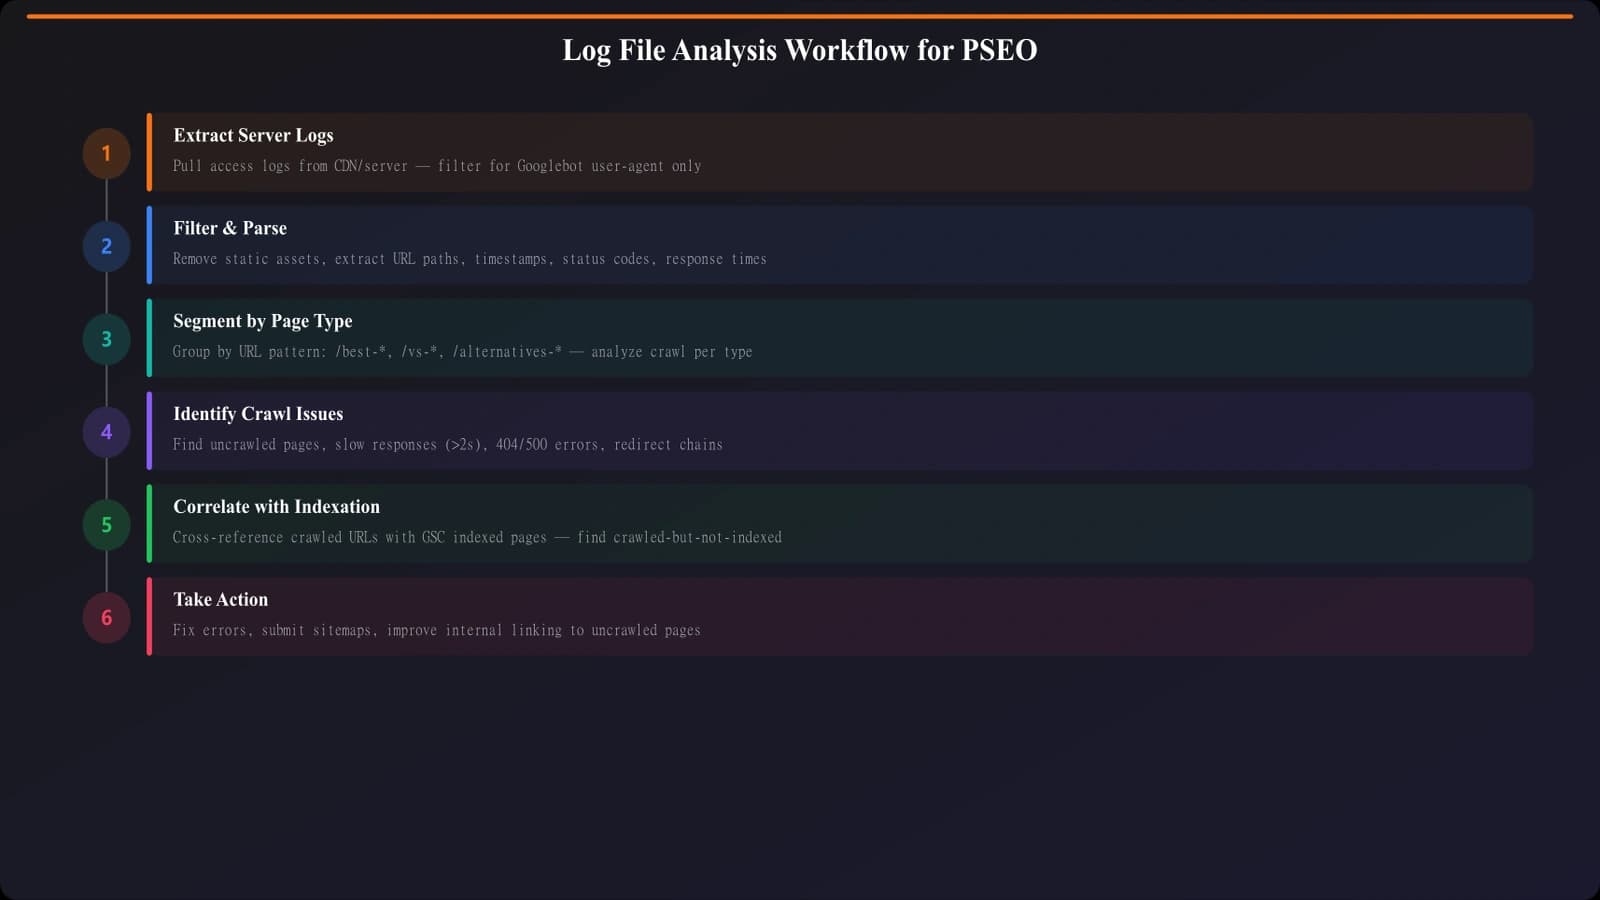
This guide covers log file analysis specifically for PSEO sites: extracting relevant data, identifying crawl patterns, diagnosing common problems, and using insights to improve indexing of your programmatic pages.
Log File Fundamentals
Understanding what logs contain and how to access them is the starting point.
Log Entry Structure
Standard server logs (Apache, Nginx) contain specific fields. A typical log entry looks like:
Example log entry:
66.249.64.123 - - [30/Jan/2026:14:23:45 +0000] "GET /compare/tool-a-vs-tool-b HTTP/1.1" 200 45678 "-" "Mozilla/5.0 (compatible; Googlebot/2.1; +http://www.google.com/bot.html)"
Key fields for SEO analysis:
- IP address: Identifies the requester (verify against known bot IPs)
- Timestamp: When the request occurred
- Request: The URL requested and HTTP method
- Status code: Server response (200 success, 404 not found, etc.)
- Bytes sent: Response size
- User agent: Identifies the client (Googlebot, Bingbot, etc.)
Accessing Your Logs
Log access varies by hosting setup:
- Traditional hosting: Access via FTP or hosting control panel; logs often in /logs directory
- Cloud hosting: AWS CloudWatch, Google Cloud Logging, Azure Monitor
- CDN logs: Cloudflare, Fastly, etc. have their own log access methods
- Managed platforms: Vercel, Netlify may have limited log access; check their logging features
For accurate bot analysis, ensure you're capturing origin server logs, not just CDN edge logs. CDN caching might mean bots hit the CDN but not your origin.
Extracting Bot Crawl Data
Raw logs contain all traffic. For SEO analysis, filter to search engine bots only.
Identifying Search Engine Bots
Filter logs by user agent strings. Key patterns to identify:
Major search engine bot user agents:
• Googlebot: "compatible; Googlebot/2.1" (desktop), "Googlebot-Mobile" (mobile)
• Googlebot-Image: Crawls images specifically
• Bingbot: "compatible; bingbot/2.0"
• Yandex: "compatible; YandexBot/3.0"
• Baidu: "compatible; Baiduspider"
Be aware that user agents can be spoofed. For critical analysis, verify Googlebot requests by reverse DNS lookup of the IP address against Google's published IP ranges.
Practical Data Extraction
Extract bot visits into analyzable format:
- Filter by user agent: Extract only rows containing bot identifiers
- Parse fields: Split into structured data (timestamp, URL, status, etc.)
- Categorize URLs: Group by URL pattern or directory for PSEO analysis
- Aggregate metrics: Calculate crawl frequency, status code distribution, timing
- Export for analysis: Save to spreadsheet or database for deeper analysis
For large log files, use command-line tools (grep, awk) or log analysis software. Manual spreadsheet work becomes impractical above a few thousand rows.
PSEO-Specific Crawl Patterns
Programmatic sites have distinctive crawl patterns worth analyzing.
Crawl Distribution Analysis
For PSEO, analyze how crawl attention distributes across your programmatic pages:
Distribution analysis questions:
• What percentage of your programmatic pages received any crawl in the past 30 days?
• Which URL patterns get the most crawl attention?
• Are newer pages being discovered promptly?
• Do certain categories get disproportionate crawl attention?
• How does crawl depth (clicks from homepage) correlate with crawl frequency?
A healthy PSEO site should show most programmatic pages receiving regular crawls. If only 20% of pages are being crawled, you have a discoverability problem.
Crawl Budget Waste
Crawl budget waste occurs when bots spend time on low-value or duplicate content instead of your important pages. Look for:
- Faceted URLs: Filter/sort parameters creating many similar URLs
- Pagination crawling: Bots spending disproportionate time on paginated lists
- Resource crawling: CSS, JS, images consuming crawl budget
- Error pages: 404/500 errors being re-crawled repeatedly
- Redirect chains: Bots following redirects instead of updated URLs
If 40% of Googlebot requests are for parameter variations you don't want indexed, that's crawl budget that could go to your actual comparison pages.
Generate Crawl-Optimized Comparisons
Build PSEO pages with clean URL structures and proper internal linking.
Try for FreeCommon Issues and Diagnosis
Log analysis reveals specific crawl problems. Here's a reference for diagnosing common issues:
| Symptom | Possible Causes | Log Evidence | Solutions |
|---|---|---|---|
| Pages never crawled | Poor internal linking, orphan pages | URLs absent from bot requests entirely | Add internal links, submit in sitemap |
| Crawled but not indexed | Quality issues, noindex, duplicate content | 200 status but not in Search Console | Check page quality, remove noindex if incorrect |
| Decreasing crawl rate | Site speed issues, quality decline | Fewer bot requests over time | Improve speed, audit content quality |
| High 404 rate | Removed pages, broken links | Many 404 status codes in bot logs | Implement redirects, update internal links |
| Slow server response | Server capacity, slow database | High bytes sent with long intervals | Optimize server, add caching |
Response Time Analysis
Server response time affects crawl efficiency. Analyze response times from bot perspectives:
Response time analysis:
• Calculate average response time for Googlebot requests
• Compare programmatic page response times to editorial pages
• Identify URL patterns with unusually slow responses
• Correlate response time with crawl frequency (slow pages get crawled less)
If your programmatic pages take 3 seconds to generate while editorial pages take 200ms, bots will deprioritize the slower content.
From Logs to Action
Log file analysis for PSEO isn't a one-time audit—it's an ongoing diagnostic practice. Establish regular log reviews (weekly or monthly) to catch crawl issues before they become indexing problems.
Start with basic questions: Are all your programmatic pages being crawled? Is crawl attention going to the right places? Are there error patterns that need fixing? Answer these, fix what you find, then move to more advanced analysis.
For complementary technical SEO work, see Technical Audit Checklist. For addressing crawl issues through site structure, see Lazy Loading Without Killing Crawlability.
Product Manager at BestPage. Pioneer in AEO research since 2024, exploring the convergence of SEO and GEO (Generative Engine Optimization). Led multiple AI-powered content optimization projects that achieved 300%+ citation increases in ChatGPT and Perplexity.